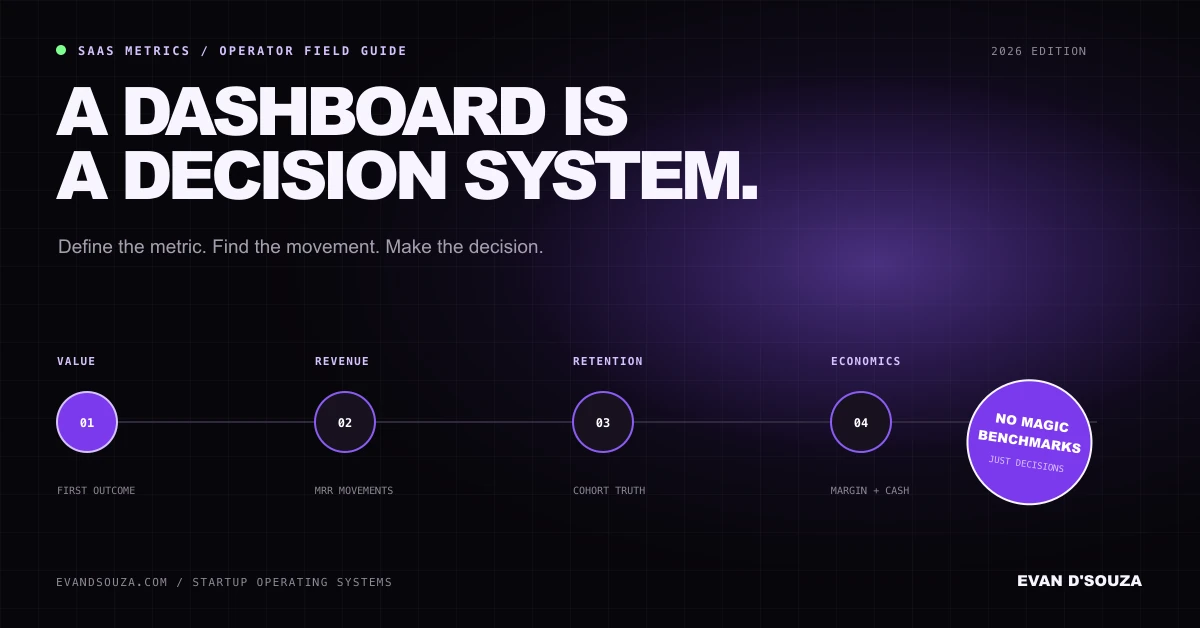
A dashboard is not a collection of important numbers.
It is a decision system.
If monthly recurring revenue changes, the dashboard should show what moved it. If onboarding slows, it should reveal where customers wait. If margin falls, it should expose which customer, feature or delivery step created the cost.
Most SaaS dashboards fail before the chart is drawn. Different teams use the same metric name with different populations, exclusions and time windows. The result looks precise while finance, product and growth are discussing different businesses.
This guide replaces generic benchmark lists with a practical operating model. It shows how to define metrics, connect them to decisions and build the smallest dashboard your current company can use.
Start With a Metric Contract
Before adding a chart, write a contract for the metric.
| Field | Question the contract must answer |
|---|---|
| Decision | What choice will this metric inform? |
| Definition | What exactly is being counted or calculated? |
| Population | Which accounts, users, plans or transactions are included? |
| Time basis | Is this a point-in-time value, period movement or cohort measure? |
| Exclusions | Are trials, taxes, refunds, discounts, services or delinquent accounts excluded? |
| Source | Which system owns the underlying event or amount? |
| Owner | Who investigates a change and recommends an action? |
| Drill-down | Can the team move from the total to the accounts or events that caused it? |
| Review rhythm | When is the metric reviewed, and against which comparison? |
This is not administrative overhead. Stripe, for example, allows teams to configure whether discounts affect MRR and when a subscriber becomes active. Its billing analytics documentation also distinguishes recurring revenue, trial conversion, subscriber activity and usage metrics. Read Stripe’s current subscription analytics definitions.
Two companies can therefore show the same label and calculate different numbers. The metric contract makes that difference visible.
Separate the Four Layers of SaaS Performance
A useful dashboard connects four layers instead of forcing every question into revenue.
1. Customer value
This layer asks whether the product creates the outcome the customer bought.
Useful measures include:
- qualified starts;
- first verified value events;
- time to first value;
- repeated value within a defined window;
- activation by acquisition source, plan or customer segment;
- workflow completion and failure reasons.
Do not define activation as the easiest event to instrument. Account creation, profile completion and invited teammates may be setup milestones. They are not proof of value unless the customer has completed a meaningful job.
The time-to-value operating guide explains how to define a value event, instrument the path and separate customer delay from company delay.
2. Recurring revenue movements
MRR is useful because it normalises recurring subscription value to a monthly basis. It is not cash collected and it is not recognised accounting revenue.
Stripe defines MRR as the monthly-normalised value of active and past-due subscriptions, subject to configuration and specific exclusions. ChartMogul likewise treats MRR as recurring subscription revenue and documents how discounts, refunds, fees and integrations can affect the result. Compare the Stripe billing definitions with ChartMogul’s MRR documentation before reconciling numbers across systems.
The total alone is not enough. Use a roll-forward:
Ending MRR =
Starting MRR
+ New MRR
+ Expansion MRR
+ Reactivation MRR
- Contraction MRR
- Churned MRR
+ or - Foreign-exchange movement, when applicable
This turns “MRR changed” into a set of operating questions:
- Which new accounts created the movement?
- Which existing accounts expanded or contracted?
- Was churn voluntary, failed payment or a definition change?
- Did a currency movement make operating performance look better or worse?
- Did a billing migration create false churn and reactivation?
Your dashboard should link every movement category to the underlying accounts. A total without a drill-down is reporting, not diagnosis.
3. Retention and customer continuity
Net revenue retention measures what happened to recurring revenue from customers present at the start of the period. New-customer revenue does not belong in the numerator.
Net revenue retention =
(Starting MRR + Expansion + Reactivation - Contraction - Churn)
/ Starting MRR
ChartMogul publishes the formula and explains how reactivation, contraction and segment changes affect interpretation in its Net MRR retention documentation.
Do not use NRR alone. Pair it with:
- gross revenue retention, which removes the benefit of expansion;
- customer or logo retention;
- retention by start cohort;
- retention by segment, plan and acquisition source;
- reasons for contraction and churn;
- time to first and repeated value.
Aggregate NRR can look healthy while a large account masks weak retention across the rest of the base. Cohorts expose whether newer customers are becoming more or less durable.
4. Economics and operating capacity
Growth can look healthy while delivery becomes less viable. Connect revenue to the cost and cash required to create it.
The core measures are:
- gross margin by product or customer segment;
- contribution margin when variable sales or service costs matter;
- customer acquisition cost by channel and segment;
- CAC payback using gross profit, not only revenue;
- implementation and support effort per account;
- model, infrastructure or third-party API cost per completed outcome;
- monthly net cash movement and runway under an explicit plan.
For AI products, model and human-review cost can change with usage. The AI SaaS pricing and gross-margin framework shows how to connect delivery cost, value metrics and packaging without billing customers for an abstraction they cannot predict.
Avoid treating MRR as accounting revenue. Subscription invoices can span service periods, upgrades can create prorations and deferred revenue must be recognised over the service delivered. Stripe’s revenue-recognition methodology demonstrates why billing analytics and financial statements answer different questions.
Choose Metrics by Operating Question, Not an ARR Bracket
There is no universal revenue threshold at which a metric becomes important. A high-touch enterprise product may face delivery complexity before it has many customers. A self-serve product may need cohort retention long before it hires sales.
Choose the dashboard from the question the company must answer next.
Can we create value repeatedly?
Use:
- qualified starts;
- first and repeated value;
- time to value;
- failure reasons;
- paid conversion or signed commitment;
- direct customer evidence.
The decision is whether the product and onboarding path deserve more demand.
Can we explain recurring revenue?
Use:
- starting and ending MRR;
- new, expansion, reactivation, contraction and churn movements;
- pipeline stage conversion with stable exit criteria;
- first-value completion for new accounts;
- revenue and account concentration.
The decision is whether the sales and delivery motion is teachable rather than founder-dependent.
Can customers remain and expand without rescue?
Use:
- gross and net revenue retention;
- customer retention;
- cohort retention;
- time to repeated value;
- support, implementation and exception load;
- customer promise continuity across handoffs.
If the team cannot operate without founder intervention, run the private Founder Dependency Scorecard before hiring someone to absorb the queue.
Can growth finance the next stage?
Use:
- gross and contribution margin;
- CAC payback by segment;
- pipeline quality and sales-cycle movement;
- cash movement and runway;
- capacity consumed by onboarding, support and exceptions;
- concentration risk across customers, channels and suppliers.
The decision is where the next unit of money or attention can produce durable capacity.
Build a One-Screen Weekly Operating Review
The executive view should answer six questions without opening another dashboard:
- What outcome are we trying to improve?
- What changed since the previous comparable period?
- Which movement or segment caused the change?
- What evidence supports the explanation?
- What decision follows?
- Who owns the next check, and when?
A practical review table looks like this:
| Metric | Current read | Driver | Decision | Owner | Next check |
|---|---|---|---|---|---|
| Time to first value | Trend plus segment view | Stage where elapsed time increased | Remove or redesign one wait | Onboarding owner | Next cohort review |
| Net MRR movement | Movement decomposition | Accounts or plans driving the change | Fix a loss pattern or test an expansion path | Revenue owner | Next weekly review |
| Cohort retention | Comparable cohort curve | Segment and churn reasons | Change qualification, promise or value path | Product and success | After sufficient cohort maturity |
| Contribution margin | Segment margin and cost movement | Infrastructure, review or service load | Reprice, constrain or redesign delivery | Finance and product | Next billing cycle |
| Cash runway | Base plan and downside case | Hiring, collections, spend or revenue variance | Change timing or protect a milestone | Founder or finance | Monthly, or sooner after material change |
The dashboard should preserve the history of decisions. Otherwise the team sees the same chart every week and repeatedly debates why it moved.
Use Benchmarks as Questions, Not Targets
A generic benchmark can be useful for spotting an unusual result. It cannot tell you whether the company is healthy without knowing the segment, contract structure, customer concentration, acquisition motion and metric definition.
Prefer this order:
- Compare the metric with its own prior comparable period.
- Compare cohorts built under similar conditions.
- Compare customer segments with the same definition.
- Use a relevant external peer group as context.
- Investigate the underlying accounts before changing strategy.
Stripe’s current billing benchmark documentation describes peer groups of at least 100 similar businesses and explains eligibility requirements. That is more useful than copying a single public number from a company with a different market and business model.
If a benchmark creates action without diagnosis, it has become a vanity target.
A Four-Week Implementation Plan
Week 1: Freeze definitions
Choose one decision from each relevant layer. Write the metric contract, name the owner and list every exclusion. Keep a versioned data dictionary.
Week 2: Reconcile source systems
Trace billing, CRM, product and support events to individual accounts. Reconcile a small sample manually. Document the known differences between billing MRR, accounting revenue and cash.
Week 3: Add drill-downs and decisions
For each metric, expose the accounts, segments or events that caused the change. Add a decision field and owner to the operating review.
Week 4: Automate only stable definitions
Automate extraction and presentation after the team can reproduce the result. Add freshness checks, missing-data alerts and a visible last-updated time. Do not automate a disagreement about meaning.
Dashboard Failure Modes
Definition drift
The same label changes after a billing migration, discount policy or status rule. Version the definition and annotate the break in the trend.
Blended averages
Enterprise and self-serve accounts, monthly and annual contracts, or new and mature cohorts are mixed into one reassuring number. Segment before interpreting.
Revenue without movement
MRR is shown without new, expansion, contraction, reactivation and churn components. The team sees the result but cannot find the operating cause.
Retention without maturity
New cohorts are compared with older cohorts before they have had the same time to churn or expand. Compare equivalent ages.
Margin without delivery labour
Infrastructure appears cheap while onboarding, support or mandatory human review is hidden in general payroll. Include costs that rise with the delivered unit.
Dashboard theatre
The team reviews charts but records no decision, owner or next check. Remove any metric that repeatedly produces admiration without action.
FAQ
What are the most important SaaS metrics?
There is no universal list. Start with the current operating question. A useful minimum often includes one customer-value measure, an MRR movement roll-forward, retention by cohort, a delivery-economics measure and cash visibility. Each needs a written definition, owner and drill-down.
How should a startup calculate MRR?
Normalise recurring subscription value to a monthly basis, then document how trials, discounts, taxes, refunds, delinquency, usage charges, services and foreign exchange are handled. Use one approved definition across the operating review. Do not treat MRR as recognised revenue or cash.
What is the difference between gross and net revenue retention?
Gross retention shows recurring revenue retained from the starting customer base without expansion. Net retention includes expansion and may include reactivation, depending on the documented definition. Track both because expansion can hide contraction and churn.
Should an Indian SaaS company use global benchmarks?
Use a benchmark only when the peer group, period and metric definition are relevant. First compare the company with its own historical periods, equivalent cohorts and customer segments. A foreign or Indian label alone does not make a business operationally comparable.
How many metrics belong on the executive dashboard?
Use the smallest set required to explain the current decisions. If a metric has no owner, drill-down or action path, it belongs in an analytical view or nowhere. The executive dashboard should make the constraint visible, not display every number the company can calculate.
The Operating Standard
A good SaaS dashboard does three things:
- defines the number so the company can reproduce it;
- reveals the accounts, movements or events that caused it;
- records the decision, owner and next check.
Everything else is decoration.
If your team has dashboards but still needs meetings and private messages to reconstruct the real status of work, that is an operating-visibility problem. Bring the metric contract and the stubborn decision to a consultation.