In the realm of problem-solving, having the right tools can make all the difference. Root Cause Analysis (RCA) coupled with Fishbone Diagrams offers a structured approach to identifying underlying issues and devising effective solutions. Let’s delve into how these techniques work together through a generic example applicable to various industries, including e-commerce customer support teams.
Understanding Root Cause Analysis with Fishbone Diagrams:
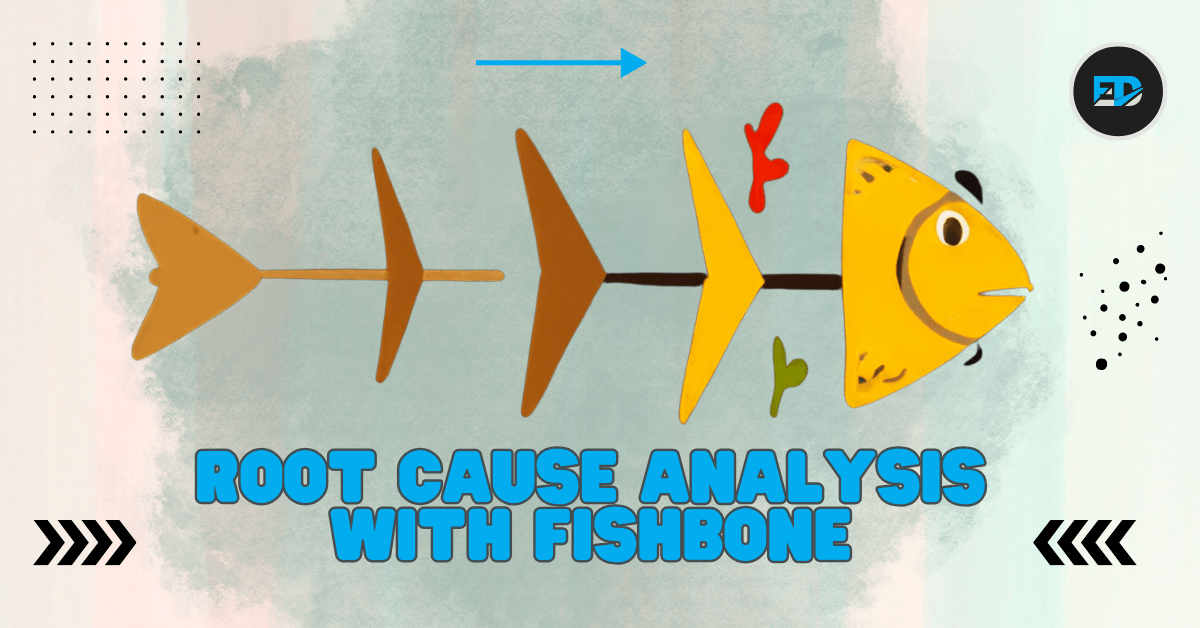
Root Cause Analysis is a methodical approach to identifying the fundamental causes of a problem rather than just treating its symptoms. Fishbone Diagrams, also known as Ishikawa or Cause-and-Effect diagrams, provide a visual representation of potential causes contributing to a problem, structured around categories such as people, process, environment, equipment, and management.
Scenario: Consider a customer support team in an e-commerce company experiencing recurring issues with vendors, leading to delayed order fulfillment and customer dissatisfaction.
Fishbone Diagram Analysis:
- Problem Statement: Delayed order fulfillment and customer dissatisfaction due to issues with vendors.
- Categories:
- People: Insufficient vendor training or communication gaps between the support team and vendors.
- Process: Inefficient vendor management processes, such as order placement and tracking.
- Environment: External factors like market fluctuations or supplier disruptions affecting vendor performance.
- Equipment: Outdated technology or tools hindering smooth interaction with vendors.
- Management: Lack of clear guidelines or oversight in vendor selection and performance evaluation.
Example Analysis:
- People:
- Inadequate training provided to vendors on order processing procedures.
- Process:
- Complex workflows for order placement and tracking leading to errors and delays.
- Environment:
- Market fluctuations affecting vendor supply chain management.
- Equipment:
- Outdated vendor management software causing inefficiencies in communication and order processing.
- Management:
- Absence of performance metrics for vendor evaluation and feedback.
Conclusion: Fishbone Diagrams provide a structured framework for Root Cause Analysis, enabling organizations to systematically identify underlying issues and develop targeted solutions. By visually mapping out potential causes, businesses can streamline processes, enhance communication, and improve overall efficiency. To explore further applications of Fishbone Diagrams and Root Cause Analysis, continue your journey into effective problem-solving.
In summary, integrating Fishbone Diagrams into Root Cause Analysis equips businesses across industries with the tools to address challenges effectively, drive continuous improvement, and achieve sustainable growth.


Leave a Reply
You must be logged in to post a comment.