Ready to dive into the world of D2C marketing metrics? Whether you’re a startup wizard or just dipping your toes in the marketing pool, understanding these metrics is key to unlocking your brand’s potential. Let’s make data your best friend and watch your campaigns soar!
Email Outreach
Email outreach is all about crafting personalized emails that catch attention and build connections. Your goal here is to generate leads and foster relationships. Know your audience by segmenting your email list based on demographics and interests. Plan a calendar for timely follow-ups and allocate a budget for tools and content creation.
How to Plan Budget?
Allocate a budget for email marketing tools and content creation. Example budget allocation:
- Email tools: $150/month
- Content creation: $200/month
Industry Standard Tools
- Mailchimp: Email marketing automation.
- Hunter.io: Email finding tool.
- Boomerang: Email scheduling and follow-up.
Example: Reading a Dummy Email Outreach Campaign Data Table
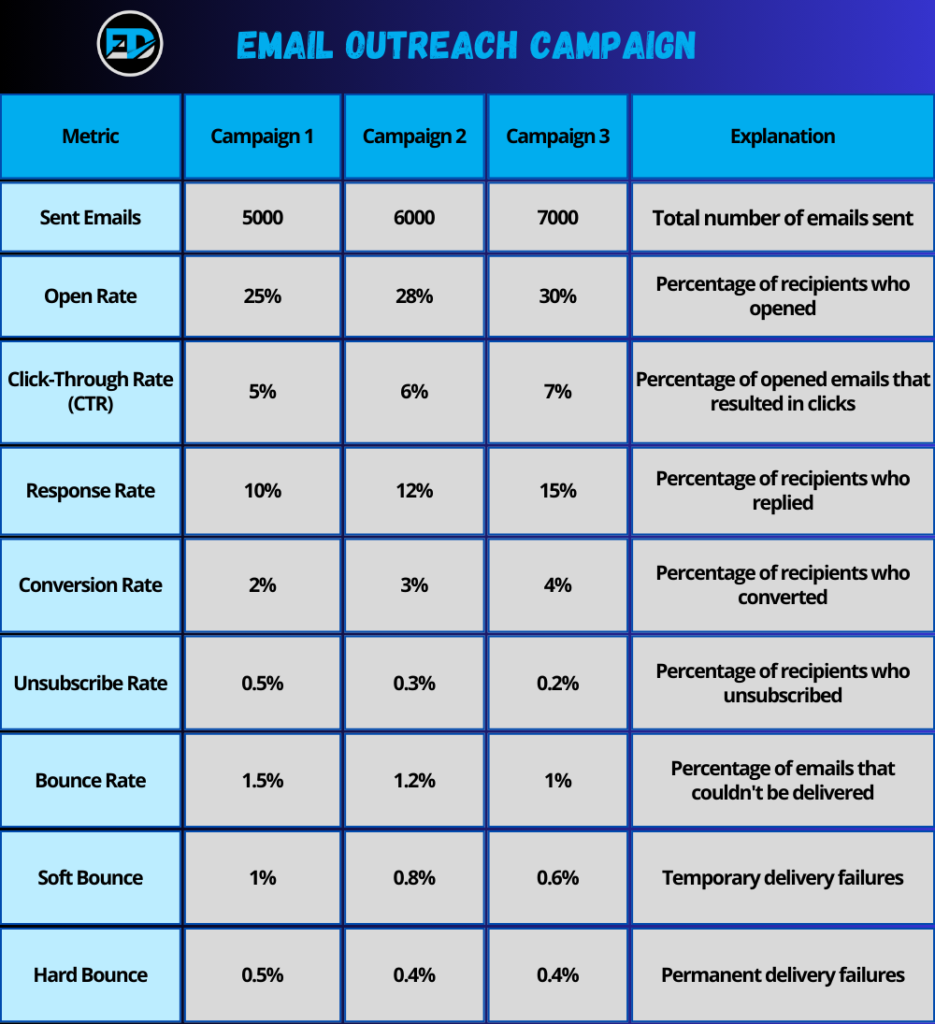
What Are the Metrics Used?
- Sent Emails: Total number of emails sent. Indicates campaign reach.
- Open Rate: Percentage of recipients who opened the email. Higher rates mean compelling subject lines.
- Click-Through Rate (CTR): Percentage of opened emails that resulted in clicks. Measures the effectiveness of your email content.
- Response Rate: Percentage of recipients who replied. Indicates engagement.
- Conversion Rate: Percentage of recipients who took the desired action. Measures campaign effectiveness.
- Unsubscribe Rate: Percentage of recipients who unsubscribed. Lower rates suggest content relevance.
- Bounce Rate: Percentage of emails that couldn’t be delivered. Lower rates indicate a healthy email list.
- Soft Bounce: Temporary delivery failures. Usually due to a full inbox or server issues.
- Hard Bounce: Permanent delivery failures. Often due to invalid email addresses.
PPC Advertising
PPC advertising lets you pay for the clicks you want. Your goal is to drive targeted traffic and boost conversions. Understand your audience through analytics and target specific demographics. Plan your campaigns and budget wisely, using tools like Google Ads for keyword research and SEMrush for competitor analysis.
How to Plan Budget?
Allocate a budget for ad spend and campaign management. Example budget allocation:
- Ad spend: $1000/month
- Management: $200/month
Industry Standard Tools
- Google Ads: PPC advertising on Google.
- Meta for Business: PPC advertising on Facebook.
- SEMrush: Keyword research and competitor analysis.
Example: Reading PPC Campaign Data Table
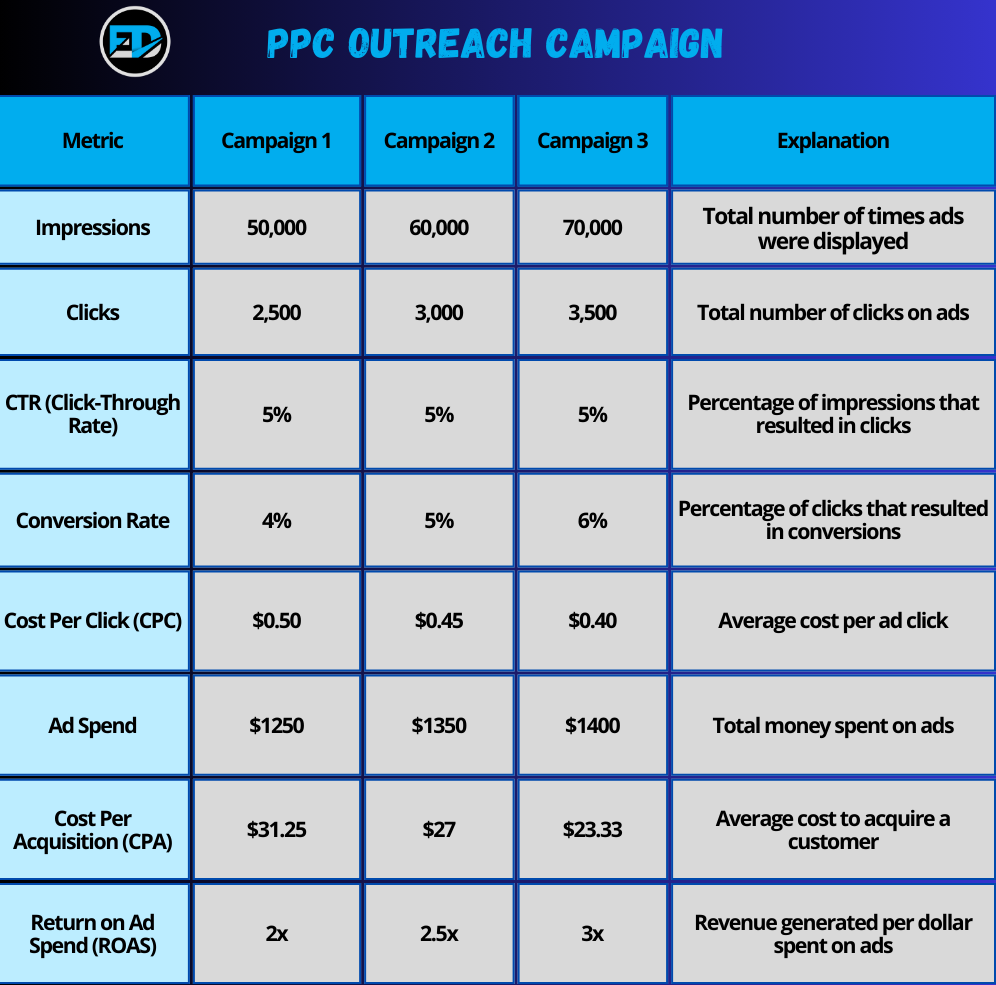
What Are the Metrics Used?
- Impressions: Total number of times ads were displayed. Indicates reach.
- Clicks: Total number of clicks on ads. Measures interest.
- CTR (Click-Through Rate): Percentage of impressions resulting in clicks. Higher rates mean effective ads.
- Conversion Rate: Percentage of clicks that resulted in conversions. Measures effectiveness.
- CPC (Cost Per Click): Average cost per ad click. Lower costs indicate efficiency.
- Ad Spend: Total money spent on ads. Helps track budget.
- CPA (Cost Per Acquisition): Average cost to acquire a customer. Lower CPA means higher efficiency.
- ROAS (Return on Ad Spend): Revenue generated per dollar spent on ads. Higher ROAS indicates better campaign performance.
SEO and Content Marketing
SEO and content marketing are your dynamic duo for attracting organic traffic. Your goal is to climb the search engine ranks and drive conversions. Understand your audience through keyword research and tailor your content accordingly. Plan a content calendar to maintain consistency and allocate a budget for content creation and SEO tools.
How to Plan Budget?
Allocate a budget for content creation and SEO tools. Example budget allocation:
- Content creation: $500/month
- SEO tools: $200/month
Industry Standard Tools
- Google Analytics: Website traffic tracking.
- SEMrush: Keyword research and competitor analysis.
- Yoast SEO: SEO plugin for WordPress.
Example: Reading a Dummy SEO and Content Marketing Campaign Data Table
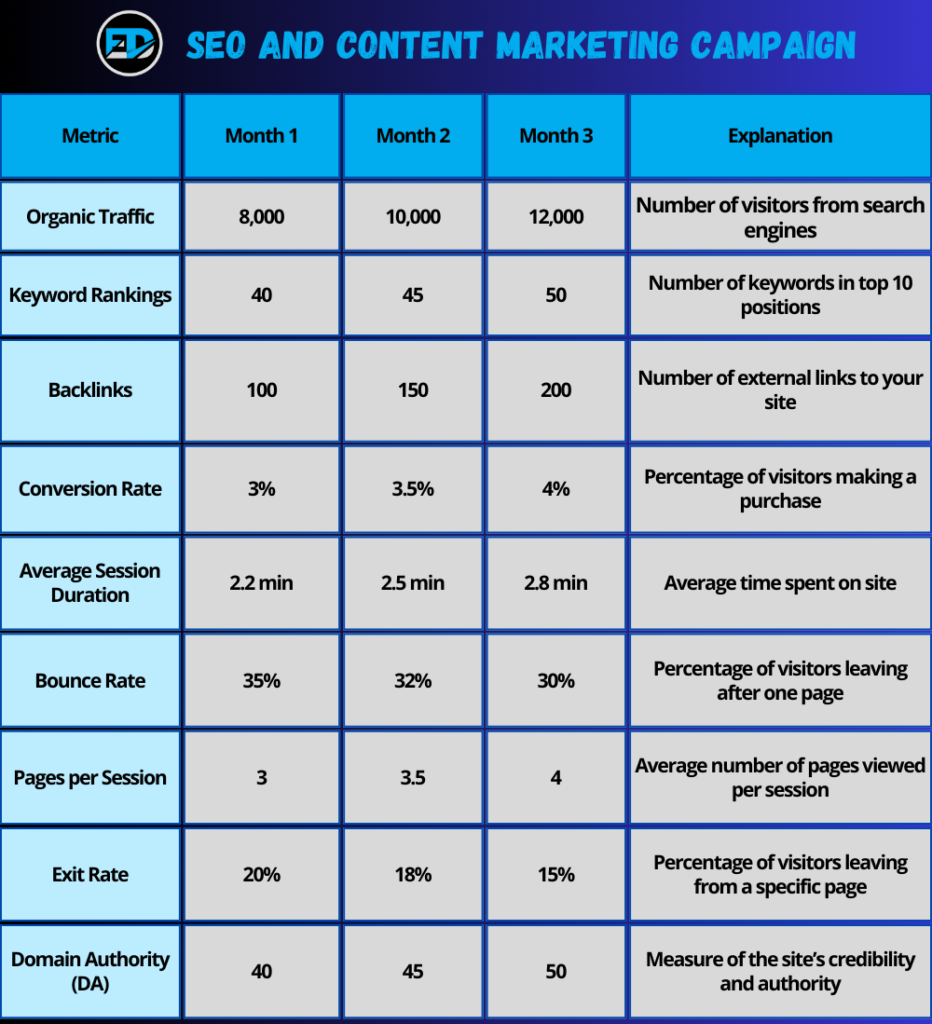
What Are the Metrics Used?
- Organic Traffic: Visitors from search engines. Higher traffic indicates better visibility.
- Keyword Rankings: Number of keywords in top positions. Higher rankings lead to more traffic.
- Backlinks: External links to your site. More backlinks improve site authority.
- Conversion Rate: Percentage of visitors making a purchase. Higher rates mean effective content.
- Average Session Duration: Average time spent on site. Longer durations suggest engaging content.
- Bounce Rate: Percentage of visitors leaving after one page. Lower rates indicate better user experience.
- Pages per Session: Average number of pages viewed per session. Higher numbers indicate engaging content.
- Exit Rate: Percentage of visitors leaving from a specific page. Lower rates indicate better content flow.
- Domain Authority (DA): Measure of the site’s credibility and authority. Higher DA means better search engine rankings.
Social Media Marketing
Social media marketing is your ticket to connect with your audience on platforms like Instagram and Facebook. Your goal is to boost brand visibility and engagement. Understand your audience by analyzing their demographics and behaviors. Plan a content calendar to ensure consistent posting and allocate a budget for ads and partnerships.
How to Plan Budget?
Allocate a budget for social media advertising, content creation, and influencer partnerships. Example budget allocation:
- Social media ads: $600/month
- Content creation: $400/month
- Influencer partnerships: $500/month
Industry Standard Tools
- Hootsuite: Social media management.
- Buffer: Social media planning and analytics.
- Sprout Social: Social media engagement and analytics.
- Canva: Content creation and design.
Example: Reading a Dummy Social Media Campaign Data Table
What Are the Metrics Used?
- Followers: Total number of followers. More followers mean a larger audience.
- Engagement Rate: Percentage of followers interacting with content. Higher engagement indicates compelling content.
- Click-Through Rate (CTR): Percentage of users clicking on links. Higher CTR means effective content.
- Reach: Number of unique users seeing content. Greater reach means more exposure.
- Impressions: Total number of times content is displayed. More impressions mean frequent visibility.
- Conversion Rate: Percentage of users completing a desired action. Higher rates indicate successful campaigns.
- Ad Spend: Total money spent on ads. Helps track budget.
- Social Share of Voice (SOV): Percentage of conversations about your brand. Higher SOV indicates stronger brand presence.
- Video Views: Number of views on your video content. Higher views mean more engaging video content.
- Story Completion Rate: Percentage of viewers who watched your story to the end. Higher rates indicate engaging story content.
User-Generated Content (UGC)
User-generated content (UGC) is about getting your customers to share their experiences with your brand. Your goal is to build community and trust through authentic content. Identify your most engaged customers and encourage them to create and share. Plan a UGC calendar to track content prompts and share stories.
How to Plan Budget?
Allocate a budget for UGC campaigns and incentives. Example budget allocation:
- Campaign management: $300/month
- Incentives: $200/month
Industry Standard Tools
- Yotpo: UGC management and review collection.
- TINT: UGC curation and display.
- Bazaarvoice: Customer reviews and ratings.
Example: Reading a Dummy UGC Campaign Data Table
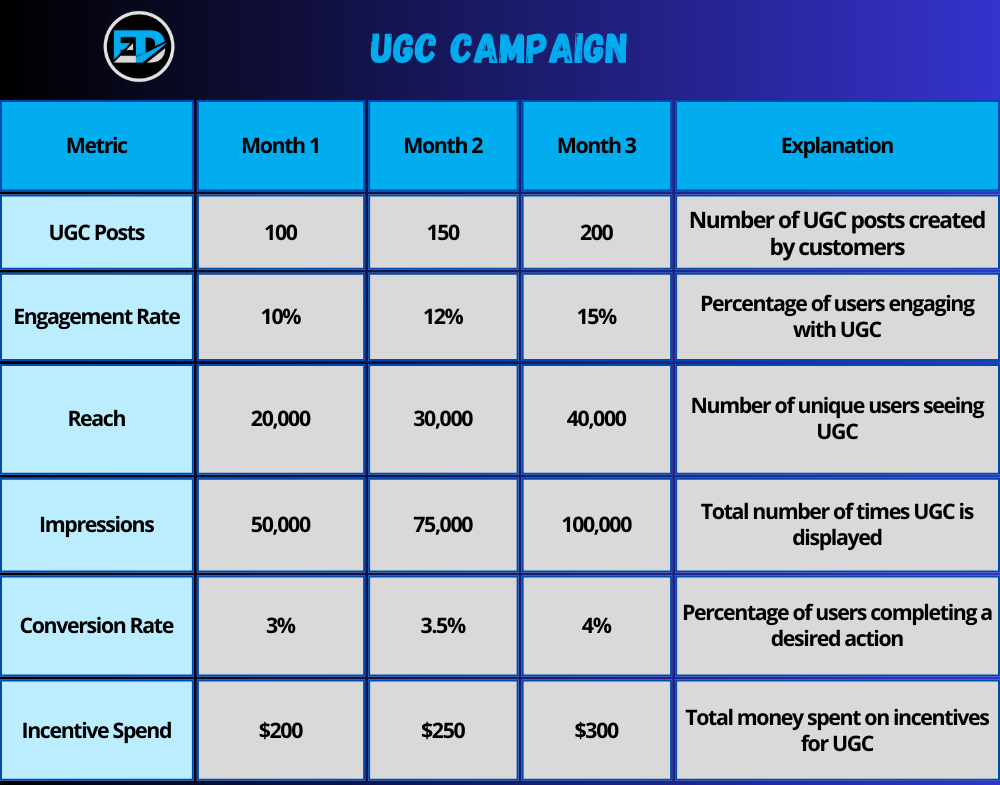
What Are the Metrics Used?
- UGC Posts: Number of posts created by customers. More posts indicate higher engagement.
- Engagement Rate: Percentage of users engaging with UGC. Higher engagement means compelling content.
- Reach: Number of unique users seeing UGC. Greater reach means more exposure.
- Impressions: Total number of times UGC is displayed. More impressions mean frequent visibility.
- Conversion Rate: Percentage of users completing a desired action. Higher rates indicate effective campaigns.
- Incentive Spend: Total money spent on incentives. Helps track budget.
Podcasts and Webinars
Podcasts and webinars are fantastic for sharing knowledge and building relationships with your audience. Your goal is to educate and engage through high-quality content. Understand your audience’s interests and pain points to create relevant episodes and webinars.
How to Plan Budget?
Allocate a budget for equipment, production, and promotion. Example budget allocation:
- Equipment: $500 (one-time)
- Production: $300/month
- Promotion: $200/month
Industry Standard Tools
- Zoom: Webinar hosting.
- Buzzsprout: Podcast hosting and analytics.
- Riverside.fm: High-quality remote recording.
Example: Reading a Dummy Podcasts and Webinars Campaign Data Table
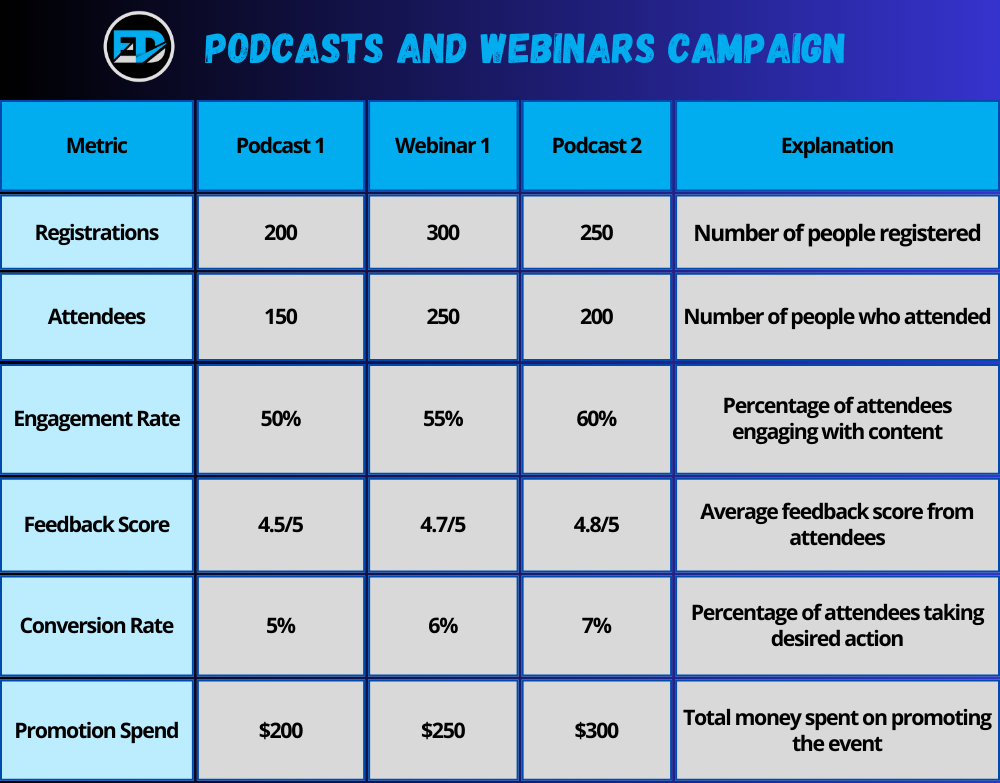
What Are the Metrics Used?
- Registrations: Number of people registered. Higher registrations mean greater interest.
- Attendees: Number of people who attended. Higher attendance indicates successful promotion.
- Engagement Rate: Percentage of attendees engaging with content. Higher engagement means compelling content.
- Feedback Score: Average feedback score. Higher scores indicate positive reception.
- Conversion Rate: Percentage of attendees taking desired action. Higher rates indicate effective content.
- Promotion Spend: Total money spent on promoting the event. Helps track budget.
Referral Programs
Referral programs turn your happy customers into brand ambassadors. Your goal is to acquire new customers through word-of-mouth and reward loyalty. Identify your most loyal customers and design an attractive referral program. Plan a calendar to track promotions and reward distribution.
How to Plan Budget?
Allocate a budget for rewards and program management. Example budget allocation:
- Rewards: $500/month
- Program management: $200/month
Industry Standard Tools
- ReferralCandy: Referral program management.
- Yotpo: Customer referral solutions.
- Post Affiliate Pro: Affiliate and referral management.
Example: Reading a Dummy Referral Program Campaign Data Table
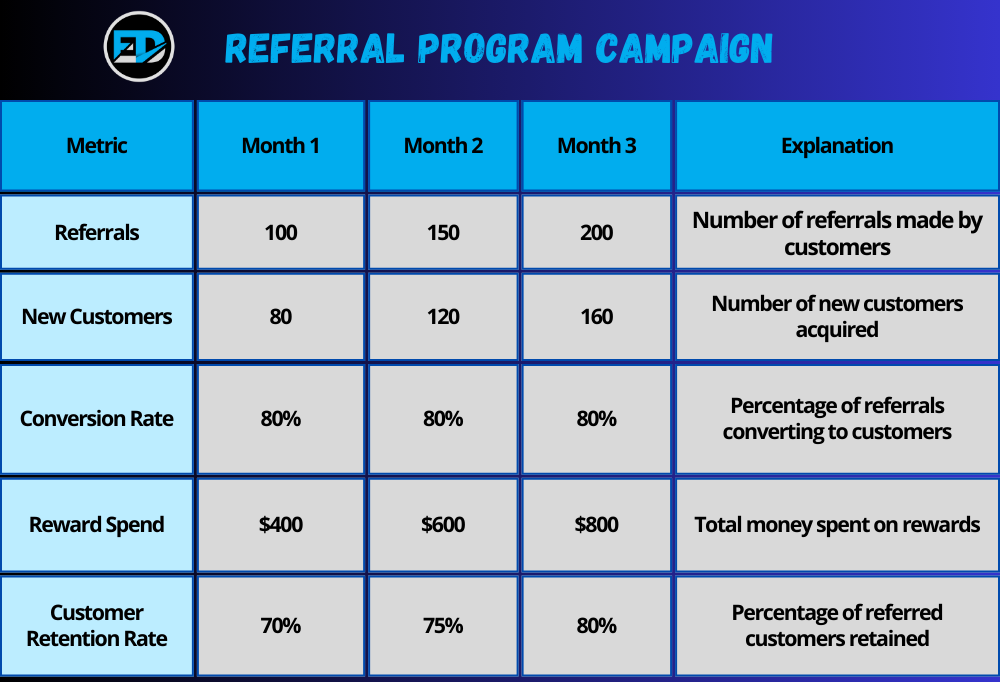
What Are the Metrics Used?
- Referrals: Number of referrals made. More referrals indicate successful program.
- New Customers: Number of new customers acquired. Higher numbers mean effective referrals.
- Conversion Rate: Percentage of referrals converting to customers. Higher rates indicate effective program.
- Reward Spend: Total money spent on rewards. Helps track budget.
- Customer Retention Rate: Percentage of referred customers retained. Higher rates mean long-term success.
Influencer Marketing
Influencer marketing is like having your cool friend vouch for you. Your goal is to reach new audiences and drive sales through trusted endorsements. Pick influencers whose followers align with your target audience and analyze their engagement rates. Plan a partnership calendar and allocate a budget for fees and content creation.
How to Plan Budget?
Allocate a budget for influencer partnerships, including fees and content creation costs. Example budget allocation:
- Influencer fees: $800/month
- Content creation: $200/month
Industry Standard Tools
- Influencity: Influencer discovery and analytics.
- Aspire: Influencer marketing platform.
- Upfluence: Influencer search and campaign management.
- Traackr: Influencer relationship management.
Example: Reading a Dummy Influencer Campaign Data Table
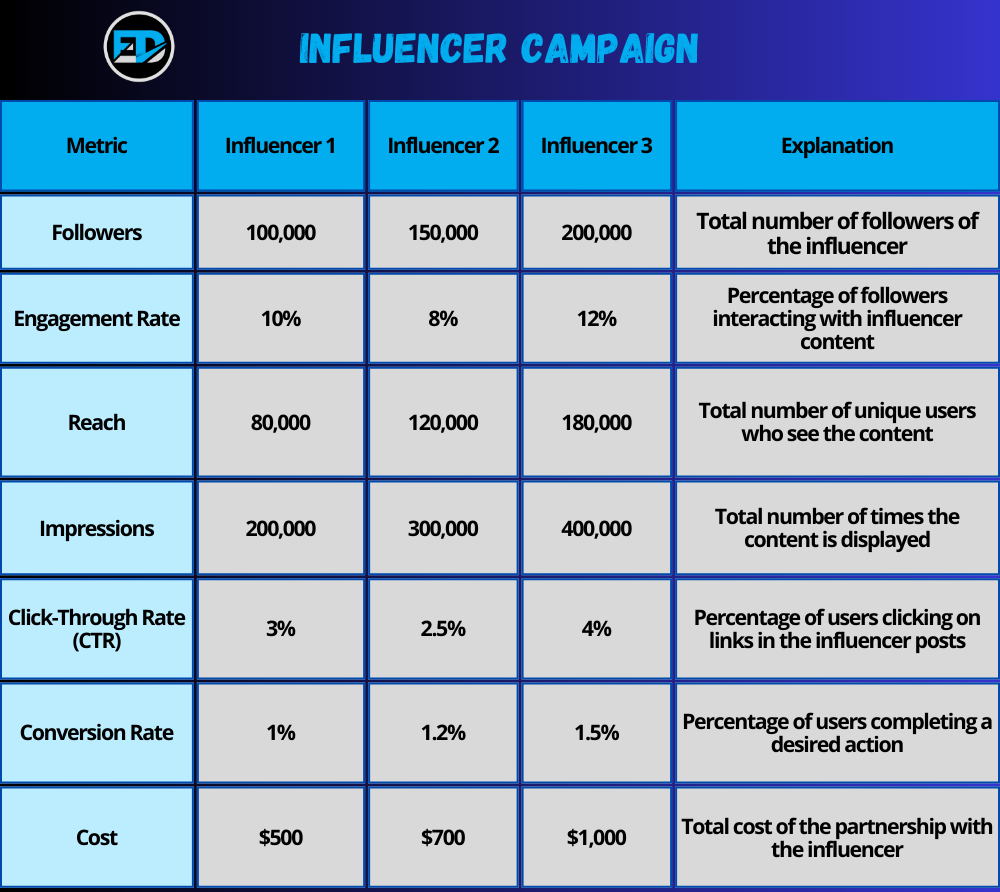
What Are the Metrics Used?
- Followers: Total number of followers of the influencer. More followers mean a larger potential audience.
- Engagement Rate: The percentage of followers interacting with the influencer’s content. Higher engagement indicates a more active and interested audience.
- Reach: The total number of unique users who see the influencer’s content. Greater reach means more exposure for your brand.
- Impressions: The total number of times the influencer’s content is displayed. More impressions mean the content is being seen frequently.
- Click-Through Rate (CTR): The percentage of users clicking on links in the influencer’s posts. A higher CTR means the content is driving traffic effectively.
- Conversion Rate: The percentage of users who complete a desired action after clicking through the influencer’s content. Higher conversion rates indicate more effective campaigns.
- Cost: The total cost of partnering with the influencer. Monitoring costs helps ensure efficient budget allocation.
Wrapping It Up
Getting the hang of D2C marketing metrics might seem like a big task, but with the right strategies, tools, and data, you’ll be a pro in no time. By understanding your audience, planning smartly, and tracking key metrics, you can fine-tune your campaigns and watch your brand thrive. Remember, marketing is all about connecting with people, so keep it fun, engaging, and data-driven. Now go out there and rock those campaigns!
FAQ
Key metrics include open rate, click-through rate (CTR), response rate, conversion rate, unsubscribe rate, bounce rate, soft bounce, and hard bounce.
CPA is calculated by dividing the total cost of your ad campaign by the number of conversions. For example, if you spend $1,000 and get 50 conversions, your CPA is $20.
Domain Authority (DA) is a measure of your site’s credibility and ability to rank in search engines. Higher DA means your site is more likely to rank well and attract organic traffic.
Recommended tools include Hootsuite for management, Buffer for planning and analytics, Sprout Social for engagement, and Canva for content creation.
To improve engagement, post high-quality, relevant content consistently, interact with your audience, use compelling visuals, and leverage hashtags and trends.
A soft bounce is a temporary delivery failure, often due to a full inbox or server issue, while a hard bounce is a permanent failure, usually because the email address is invalid.


Leave a Reply
You must be logged in to post a comment.